Mass Spectrometry of Biomolecules
Mass spectrometers used for the analysis of macromolecules from biological sources, such as proteins, peptides, DNA or RNA oligomers, have experienced tremendious improvements in recent years. Electrospray ionization mass spectrometry (ESI-MS) and matrix assisted laser desorption time-of-flight mass spectrometry (MALDI-TOF MS) have become the methods of choice. Both techniques are powerful analytical tools by themself, but are most powerful if used in combination with techniques such as gel electrophoresis, electroblotting, LC, CE or protein sequencing. This is the major technology used for proteomic approaches.
Key Words
| ESI |
Electrospray Ionization. A method for ionization in which a solution is nebulized at high voltage to form multiple protonated molecules (epg., protein/peptides) or deprotonated moleculs (epg., oligonucleotides). |
| MALDI |
Matrix assisted Laser Desorption Ionization. A method for ionization of large molecules, like proteins, using an ultraviolet laser beam. A UV-absorbing matrix, like sinnapinic acid, is mixed with the analyte to aid in vaporization. |
| Ion Trap |
Quadrupole Ion Trap Mass Spectrometer. A mass spectrometer constructed of three electrodes (two end cap electrodes and a ring electrode), which are assembled to form a three-dimensional trapping area in which ions are held by radio frequency voltages. This instrument is capable of high sensitivity and high resolution mass analysis in addition to performing tandem experiments within a single mass spectrometer. |
| MSn |
Tandem Mass Spectrometry (MS/MS). The process by which an ion is isolated by one mass spectrometer followed by collisional dissociation with an inert gas and finally mass analysis in a second mass spectrometer. This method is used for obtaining structural information. |
| TOF |
Time-of-flight Mass Spectrometer. Instrument for measuring mass-to-charge ratio dependent on the flight time of an ion. |
Abbreviations
| CE |
capillary electrophoresis |
| CE-MS |
capillary electrophoresis mass spectrometry |
| ES |
electro spray |
| HPLC |
high performance liquid chromatography |
| HV |
high voltage |
| kD |
kilodalton |
| MS |
mass spectrometry |
| MW |
molecular weight |
| PAGE |
polyacrylamide gel electrophoresis |
| SDS-PAGE |
sodium dodecylsulfate polyacrylamide gel electrophoresis |
| TOF |
time of flight |
| MALDI-TOF-MS |
Matrix assisted laser desorption/ionization time-of-flight mass spectrometry |
| UV |
ultra violet |
Introduction
Since 1988, two new methods have emerged for getting proteins into the gas phase as intact molecular species bearing integral excess charges:
-
Matrix-assisted laser desorption MS and
-
Electrospray ionization MS
The laser desorption experiment is optimally combined with TOF mass measure¬ments (price range: $100,000.00 to 500,000.00 for a new instrument), whereas the electrospray method is optimally combined with a quadrupole mass filter (price range: $450,000.00 to 2,000,000.00). Both methods give mass accuracy of up to 1 part in 10,000 for proteins with MWs less than 30 to 40 kD and somewhat reduced mass accuracy for larger proteins.
Proteins with molecular masses of up to more than 100 kilodaltons can be analyzed at picomole sensitivities to give simple mass spectra corresponding to the intact molecule. Accurate measurements of the molecular weights (MWs) of biopolymers are necessary for this analytical technique. Most of the techniques developed to date for the measurements of the masses of proteins have accuracies limited to 5 to 10%. The most widely used of these techniques is sodium dodecylsulfate-polyacrylamide gel electrophoresis (SDS-PAGE). SDS-PAGE has assumed a pivotal role in biological research because of the power of simple visualization of the total protein content of a sample, together with crude information on the relative MWs and approximate amounts of the proteins present. A tech¬nique with high accuracy is matrix-assisted laser desorption/ionization time-of-flight (TOF) mass spectrometry (MS). This technique provides a measure of the mass of a pro¬tein with an accuracy of ~0.01%.
Matrix-Assisted Laser Desorption MS
All mass spectrometers designed to analyze proteins consist of two essential compo¬nents, the ion source and the mass analyzer. In the ion source, a seemingly unlikely phase transition is effected: proteins introduced as solids or in solution are converted into intact, naked ionized molecules in the gas phase. Subsequently, in the mass analyzer, the mass-to-charge (m/z) ratios of the naked protein molecule ions are determined.
Methodologies have been developed whereby intact protein ions could be generated in large numbers by laser photon bombardment of protein-containing samples. An intense production of intact, naked ionized protein molecules can be achieved when dilute proteins imbedded in a solid matrix are bombarded with intense, short duration bursts or pulse of focused ultraviolet (UV) laser light, often 337 nm from a N2 laser. The solid matrix consists of low-MW organic molecules that strongly absorb the UV irradiation (See figure below for a schematic of the set up). Several compounds for use as matrices have been studied. The choice of the proper matrix is still semi-empirical and may depend on the nature of the sample studied.
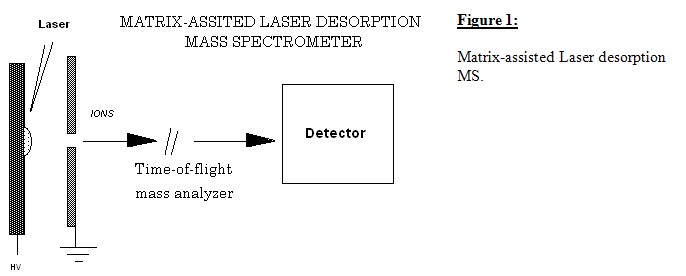
Samples are prepared for mass analysis by adding a protein, a mix of proteins, a peptide or a mix of peptides (e.g. tryptic digest of a protein) to a concentrated aqueous solution containing a large molar excess of a matrix-forming material such as 3,5-dimethoxy-4-hydroxycinnamic acid (sinpinic acid) (see table 1 for matrices and their range of laser wavelengths). A small volume of this mixture containing ~1 pmole of the protein or proteins is dried on a sample probe and inserted into the mass spectrometer. Matrix materials to analyte ratio is 1000-10,000 : 1 M concentrations, respectively. In the mass spectrometer, the sample (consisting of a layer of matrix microcrystals containing isolated protein molecules) is bombarded with short duration (1 to 10 ns) pulses of UV laser light (typically, 337 nm from a nitrogen laser or 355 nm from a frequency-tripled Nd:YAG laser). The interaction of the laser pulse with the sample causes a fraction of the matrix and trapped proteins to go into the gas phase and causes the protein to be ionized. A static electric field is imposed upon ions generated from the sample by application of a high potential (typically +- 30 kV) to the sample probe with respect to a closely spaced accelerating electrode. Protein ions are thus accelerated through the orifice in the electrode and enter into a field-free flight-tube (typical length is 50 to 200 cm). The masses of the protein ions can be simply determined by TOF analysis. Because all ions are accelerated through a fixed potential difference, the velocity of the ions is proportional to (m/z)-1/2. As the ions pass through the field-free flight-tube, they separate into a series of spatially discrete individual ion packets, each traveling with a velocity characteristic of its m/z ratio. A detector positioned at the end of the field-free flight-tube produces a signal as each ion packet strikes it. A recording of the detector signal as a function of time yields a TOF spectrum. The difference between the start time, set by the occur¬rence of the laser pulse and common to all ions, and the arrival time of an individual ion at the detector is proportional to (m/z)+1/2 and can be used to calculate the ion's m/z ratio. Such a calculation can be used to convert the x-axis of the spectrum (TOFs) into a m/z ratio axis (a conventional mass spectrum). All ions of different m/z ratios arising from a single laser shot are measured; they simply arrive at the ion detector at different times. The MALDI systems are calibrated by measuring the ion arrival times of known reference standards. This calibration may be performed either externally for routine analysis or with an internal standard for higher accuracy analysis. The technique is primarily a qualitative technique, so the relative peak heights or areas may not accurately represent the ratios of components present in a sample. Additionally some components have higher desorption/ionization yields than others. This can be often observed in the MALDI analysis of protein digest mixtures where most, but not necessarily all, of the expected fragments are observed. Recent work of several investigators suggests that the technique can be used for semiquantitative analysis runs of mixtures of defined components.
Performance specifications of MALDI-TOF-MS for a high-quality commercial in¬strument include a resolution of 400 (mass range is 200 to 800 kilodaltons), a mass determination accuracy up to 1 part in 104, a sensitivity of better than 1 pmole, and a spectrum acquisition time of 1 min. The method appears almost universal for proteins that can be dissolved in appropriate solvents, such as a volume/volume ratio of 2:1 of 0.1% triflouroacetic acid-acetonitrile or 100% hexafluoro-isopropanol (for proteins with hydrophobic character). The technique has the ability to analyze complex mixtures of peptides and proteins in the presence of large molar ex¬cesses of salts, buffers, lipids, and other species. The limitations that need to be consid¬ered include the occurrence of adduct artifacts that limit the mass accuracy for masses greater than 30 to 40 kD, the requirement that both the protein and the matrix material be soluble in the solvent mixture used, and the poisoning effect on the mass spectra of traces of ionic detergent (such as SDS) or involatile additives (such as glycerol and dimethyl sulfoxide).
The physicochemical events leading to the transfer of proteins to the gas phase and their ionization in matrix-assisted laser desorption/ionization have not yet been fully explained. The matrix is believed to serve several functions, including absorption of energy from the laser light and the isolation of individual protein molecules within the large mo¬lar excess of the solid matrix. The protein-matrix mixture typically forms a microcrystalline layer spontaneously upon drying the sample on the insertion probe tip. Upon irradiation with a short duration pulse of laser light, one model for the mechanism assumes that the upper-most layer of matrix is induced to undergo a phase transition from the solid to the gas phase. The subsequent expansion of these matrix molecules into the vacuum drags the matrix-isolated protein molecules into the gas phase. During the transfer to the gas phase, the proteins undergo ionization through proton transfer reactions with the matrix by reaction processes that are not yet understood.
Table 1: Some commonly used matrices
|
Matrix
|
Wavelength (nm)
|
|
|
|
Nicotinic acid
|
266, 220-290
|
|
Benzoic acid derivatives
2,5-Dihydrobenzoic acid
Vanillic acid
2-Amino-benzoic acid [2ABA]
|
266, 337, 355
266
266, 337, 355
|
|
Pyrazine-carboxylic acid
Picolinic acid [PA]
|
266
266
|
|
3-Aminopyrazine-2-carboxylic acid
|
337
|
|
Cinnamic acid derivatives
Ferrulic acid
Sinapinic acid [SA]
Caffeic acid
|
266, 337, 355
266, 337, 355
266, 337, 355
|
|
3-Nitrobenzyl alcohol
|
266
|
Table 2: Structure of commonly used matrices
Correlation of Processed Proteins with their Genes
Once the cDNA sequence of a gene has been determined accurate, measurement of the MW of the corresponding protein can provide valuable information. If the measured mass of the protein agrees with that calculated from the gene sequence, it is likely that the deduced sequence is correct, the amino and carboxyl terminals of the mature protein have been correctly assigned, and the protein contains no post-translationally modified amino acid residues. A difference between the measured and predicted MWs implies either an error in the cDNA deduced sequence or a post-translational modification or processing of the protein. Sometimes, differences are observed between the measured and calculated MWs that are more difficult to interpret. In such cases, a useful strategy involves degradation of the protein by chemical or enzymatic means and measurement by MALDI-TOF-MS of the total mixture of peptide products so generated. Comparison of the accurately measured masses of the degradation products with those predicted from the cDNA sequence yields information on the sites and natures of modifications and errors.
Glycoprotein Analysis
The determination of the carbohydrate portion of glycoproteins provides an analytical challenge to researchers, especially when only small amounts of sample are available. The reason for this is the very large number of isomers that are possible when these structures are built up from their constituent monosaccharides. Unlike peptides and oligonucleotides, which are composed of linear head-to-tail combinations of different amino acids and nucleotides, respectively, oligosaccharides contain many isobaric monosaccharides that not only can be linked through different hydroxy groups, but also can form complex branching patterns. See Figure 2 below for an example.
Monosaccharide composition and sequence analysis alone is not sufficient to determine the detailed primary structure. Only nuclear magnetic resonance (NMR) has the capability of identifying an oligosaccharide structure, but it lacks the sensitivity to address many biological problems. Mass spectrometry is much more sensitive but requires that the molecules be made volatile before analysis. MALDI-TOF-MS has been introduced for the ionization of large peptides and proteins. However, it has been shown that other compounds, including oligosaccharides, could be ionized (Mock et al., 1991).
All methods and strategies developed so far may be applied without or, if necessary, with the needed modifications to enable the use of the techniques mentioned above for mass and structure elucidation when glycoproteins are studied. Combination of HPLC or CE with MS peptide mapping of a protein is ideal for evaluating the presence of modifications, including those labile to the conditions of the Edman degradation. To obtain the best signals for oligosaccharides, the dried mixture of sample and matrix can be redissolved on the target with ethanol and allowed to recrystallize.
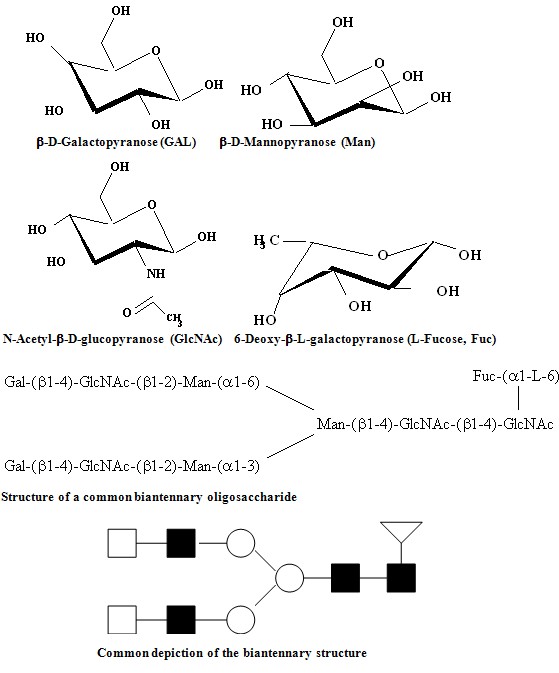
Figure 2: Top: Structures of ß-D-Galactopyranose (GAL), ß-D-Mannopyranose (Man), N-Acetyl-ß-D-glucopyranose (GlcNAc), and 6-Deoxy-b-L-galactopyranose (L-Fucose, Fuc), the four constituent monosaccharides of a common N-linked biantennary oligosaccharide shown below. Common abbreviations are shown in parentheses. Linkage in N-linked oligosaccharides is always through the 1-position of the monosaccharides to the left of the structure to any other position on the adjacent monosaccharides as shown at the bottom of the figure. Structures may be abbreviated with symbols replacing the monosaccharides as shown at the bottom of the figure. o = Gal, n = Man, f = GlcNAc, Ñ = Fuc.
Phosphoprotein Analysis
Phosphoproteins play a central role in many intracellular processes, including signal transduction and regulation of cell division. The site and extent of phosphorylation of key proteins are believed to play an important regulatory role in many intracellular signaling pathways.
The following is an example to demonstrate the analytical capabilities of the technique: The enzyme "cAMP-dependent protein kinase" is a complex with a mass of 178 kD and is made up of two regulatory and two catalytic subunits (Knighton et al., 1991, Chrivia et al., 1988). If cAMP is present, which binds to the regulatory subunit, the complex dissociates and releases the enzymatically active catalytic subunits. The 3-D molecular structure of the catalytic subunit of cAMP-dependent protein kinase has been determined by x-ray crystallography. The protein consists of 350 amino acids with a molecular mass of 40,440 daltons.
The alpha catalytic subunit of cAMP-dependent protein kinase from the mouse was cloned and expressed in Escherichia coli. The recombinant protein was isolated as a mixture of molecular species, all containing the same peptide chain but differing from each other in the degree of phosphorylation at specific residues. Three isoforms of the recombinant enzyme were prepared in highly purified form for structural analysis. Each was believed to be a homogeneous molecular species. The final stage of purification resulted in the protein samples being in a high salt buffer. The use of on-line reverse-phase HPLC-electrospray MS allowed the determination of the MWs of the three isoforms. The experiment simultaneously evaluated the purity of the proteins and desalted them in a form suitable to electrospray MS analysis.
The isoforms differed from one another by the mass of a single-PO3H group (80 daltons). The predicted sequence of the mature form of the recombinant polypeptide chain asks for a calculated mass of 40,440 daltons. Isoform I had a molecular mass of 40,759 daltons, 319 daltons above the calculated mass and therefore containing four phosphate groups (319/80). Isoform II had a mass of 40,678 daltons (that is, -81 daltons with respect to I and +238 daltons with respect to the parent polypeptide chain) and thus contained three phosphate groups. Isoform III had a mass of 40,600 daltons (that is, -78 daltons with respect to II, -159 daltons with respect to I, and +160 daltons with respect to the parent) and had two phosphate groups. The data confirmed that the isoforms were of high purity and were homogeneous molecular species. The differences in phosphate content of the three isoforms were consistent with prior data.
Although the above work was done using electrospray MS similar results may be obtained using MALDI-TOF-MS. The results showed that phosphoproteins can be analyzed by MS. The accuracy of MW measurement is well within the limits for useful determination of the degree of phosphorylation of intact proteins of typical size. The combination with enzymatic digestion and HPLC- or CE-MS peptide mapping is feasible to allow for a powerful technique for the structural characterization of phosphoproteins.
PROTEIN SEQUENCE DETERMINATION
Determination of the amino acid sequence of a protein molecule plays a central role in much biological research. Typically, the biological researcher's first direct observation of a protein would be by 1-D or 2-D PAGE. A critical step in the study of many biologically im¬portant proteins is the determination of limited stretches of amino acid sequence data from 5 to 100 picomole amounts of the natural protein isolated from a biological source. These limited sequence data are frequently the key information used to identify and clone the gene corresponding to the protein of interest. The nucleic acid sequence of the gene is then determined and translated to afford the complete amino acid sequence of the translation product. After cloning and expression of the identified gene, amino acid sequence data are used to confirm the structure of the protein produced. At the present time, amino acid sequence data are almost invariably generated by automated Edman degradation of a pro¬tein from the amino terminal, either of the intact protein or of peptides separated after proteolytic digestion of the protein.
Protein ladder sequencing with one-step MS readout.
Chait and Kent (1992) and others have described a new approach to determine the amino acid sequence of picomole amounts of a protein which takes advantage of the ability of MALDI-TOF-MS to accurately and rapidly measure protein mixtures. Manual Edman chemistry is used prior to mass analysis to generate, in a controlled fashion, a family of sequence-defined fragments from a polypeptide chain. The sequence-defined fragments are analyzed and read out using laser desorption MS to simultaneously generate the complete data set in a single operation as a protein ladder. Mass differences between consecutive peaks define the identity of a particular amino acid, based on the distinctive mass of each genetically coded amino acid. Problems arise in the differentiation between leucine and isoleucine (same mass) and glutamine and lysine (Gln and Lys; 0.04 D mass difference). The family of fragments found defines the sequence of amino acids in the original peptide chain. One way of generating the sequence-defined set of fragments from a peptide or protein is to carry out the Edman degradation in the presence of a terminating agent (This is not automated yet. The reactions are done in a volume containing > 5 picomoles. Even so, only picomole amounts are needed for the experiment. A terminating reagent may not be needed if reaction times and temperature are optimized.). The protein ladder sequencing method relies on the capabilities of matrix-assisted laser desorption MS to measure the MWs of proteins and peptide with high accuracy. This method is as yet unproved for very small amounts of proteins of unknown sequence isolated from biological sources, but the potential exists for speeding up and simplifying protein sequencing.
Future Developments
There is a need for further improvement of methods for sample preparation for Edman chemistry sequencing as well as for ion production for matrix-assisted laser desorption MS. It is desirable to be able to use water as a matrix, which would allow the direct examination of biological specimens.
The resolution for TOF instrumentation for proteins is constantly increasing towards the resolution imposed by the envelope of the isotope distribution over the full mass range of interest. Furthermore, the speed for data collection and analysis is also in a state of constant improvement. Many researchers are working towards this goal at present. This will lead to further improvement of the described techniques in regard to resolutiona and through-put in the near future.
For rest of information, please click on PDF links below.